| Back to |
Local Deposition of Particles in a Laboratory-Scale
Electrostatic Precipitator with Barbed Discharge Electrodes
J. Miller 1) H.-J. Schmid 2) E. Schmidt 2) A.J. Schwab 1)
1) Institut fur Elektroenergiesysteme und Hochspannungstechnik
University of Karlsruhe, Kaiserstr.12, D-76128 Karlsruhe, Germany
2) Institut fur Mechanische Verfahrenstechnik und Mechanik
University of Karlsruhe, Kaiserstr. 12, -D-76128 Karlsruhe, Germany
Abstract
The precipitation of particles in an electrostatic precipitator (ESP) results in striking dust patterns at the collecting electrodes, strongly depending on forces of the electro-hydrodynamic (EHD) field in the duct. Due to precipitator geometry, electrical operation status, and process parameters, areas of high and low dust density are visible. Since latest results show a direct correlation of precipitator efficiency with the shape and size of those patterns, a better knowledge of local dust layer properties is necessary in order to improve the performance of electrostatic precipitators, e.g. by electrode optimization.
For this paper experimental investigations were carried out with a laboratory scale electrostatic precipitator. In order to analyze the different characteristics of the collected dust at compressed and light dust layer regions, particle size distributions and dust layer porosity were determined with the help of a scanning electron microscope (SEM). Moreover, high accuracy weight measurements were executed to reveal preferred dust deposition along the collecting electrodes.
Whereas the dust mass varies only insignificantly for short-time particle collection (e.g. I minute), the dust mass in high-density regions is much larger after having collected a dust layer for a longer period (eg. 45 minutes). This phenomenon is due to a permanent dust layer erosion by forces of the gas flow. Moreover, a totally different structure of the dust layer can be observed directly opposite and between the discharge electrodes. Porosity investigations underline the observations and prove significantly lower porosity in dust layer areas directly opposite of the coronating barbes. The different particle size distributions of dust at high- and low-density regions of the dust layer show that fine particles were preferably deposited in high-density regions.
Since the dust layer patterns strongly depend on design and arrangement of the discharge electrodes, the results show potential for an improvement of the ESP-geometry. Further, the porosity investigations explain observations of local back corona occurrence at the dust layer.
1. Introduction
The efficiency of ESPs strongly depends on both, design and arrangement of the discharge and collecting electrodes and on the adjusted electric operation point. For fine-dust separation barbed discharge electrodes are often used in order to obtain a favorable charge injection and sufficient particle charging. In contrast to wires or striped steel, barbed discharge electrodes do not provide an irregular Corona along the electrode with non-equidistant Corona glow points, but cause defined glow points and significantly higher current densities (Fig. 1).
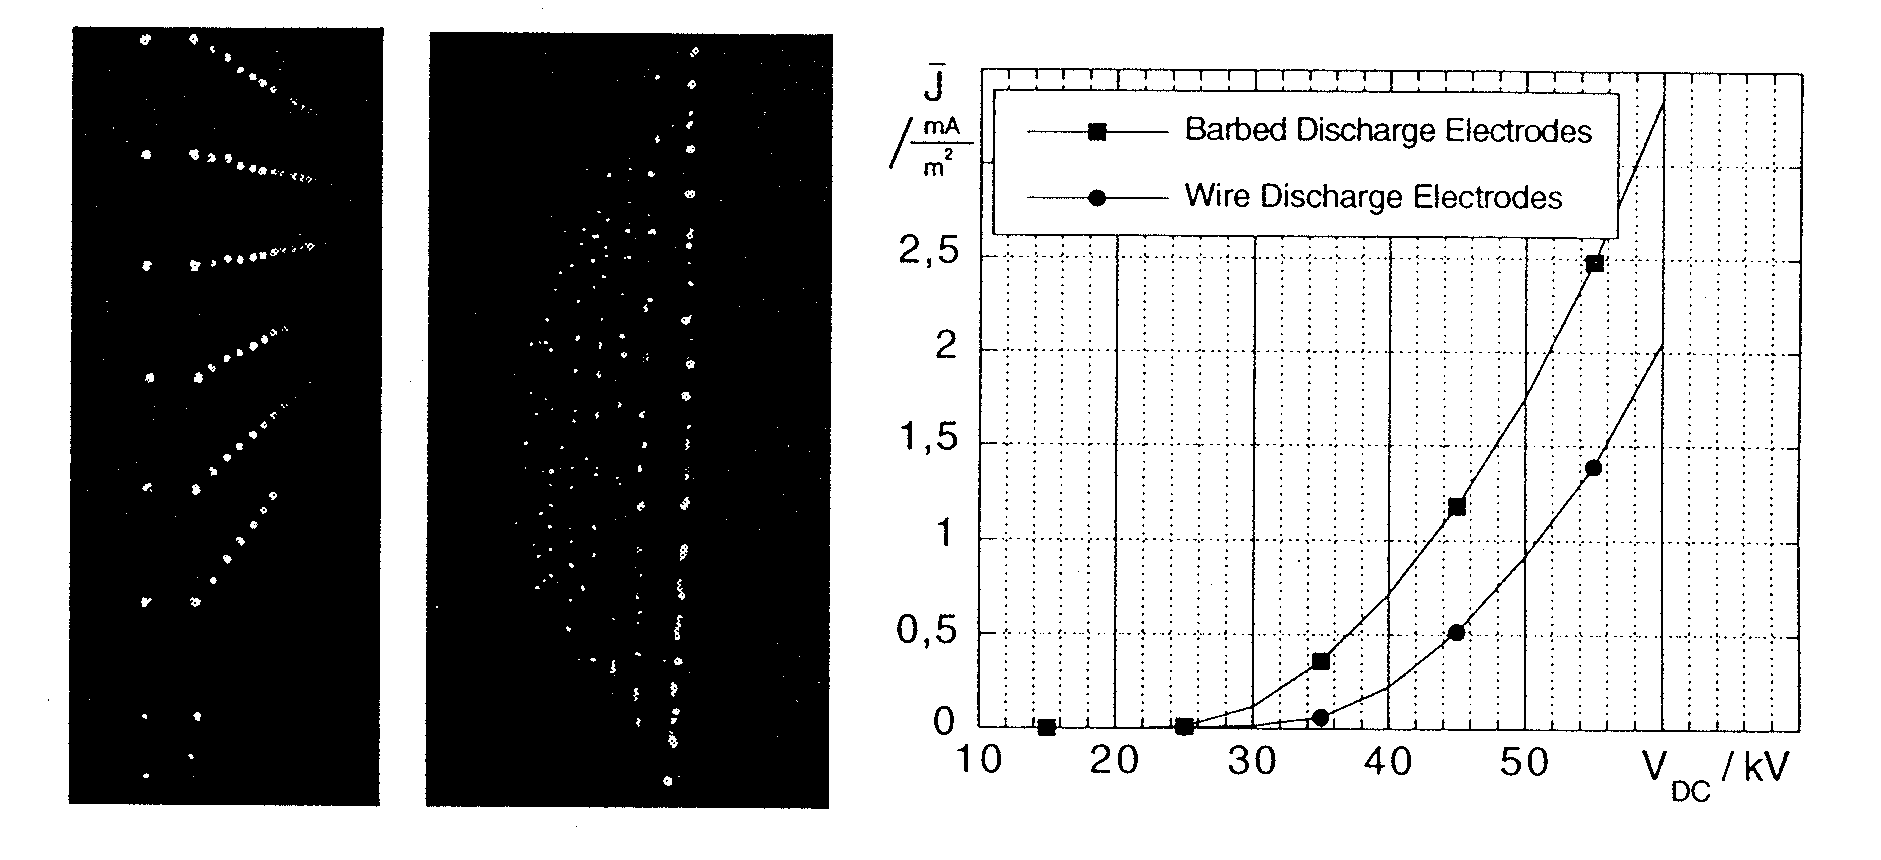
Fig.l: Visual corona behavior (left) and JV-characteristics (right) of barbed and wire discharge electrodes.
The negative ions generated by means of Corona discharges are charging
the particles in the gas electrically. The drift velocity of these ions is approximately
two orders of magnitude higher as the gas velocity and a momentum is transferred on
neutral gas molecules during collisions with the ions. The neutral gas molecules are
accelerated towards the collecting electrode, resulting in a massive gas flow from the
discharge electrode towards the collecting electrode. This phenomenon is known as electric
wind, ionic wind or secondary gas flow [1,2]. Whereas the secondary gas flow is
insignificant for wire electrodes, severe jets are visible when using barbed electrodes.
According to the continuity law, a backflow occurs half way between the discharge
electrode (Fig. 2). Consequently, large eddies arise in the gap.
As a result of secondary gas flow and local current density distribution significant
patterns occur directly opposite the coronating barbes where the dust layer is highly
packed. In back flow regions, the layer appears porous and of low-density. The phenomenon
is 3-dimensional when using barbed discharge electrodes and a back flow also occurs
vertically between the barbes. In this case the high-density areas are ellipsoidal (Fig.
2).

Fig. 2: Left: Dust patterns at
the collecting electrode occurring with barbed discharge electrodes.
Right: Schematic secondary
gas flow.
Due to the formation of the EHD field the structure of the collected dust layer changes for various discharge electrodes. Since the intensity of back corona and the permanent erosion of yet precipitated particles [3,4] may be considerably influenced by the structure and size of the dust layer pattern s, special attention must be given on the properties of these regions. Experimental investigations provided information about the local dust layer porosity. Further, the dust layer mass was measured along the duct and particle size distributions of collected dust were determined in dust layer regions of high and low density.
2. Laboratory Scale ESP
All experimental investigations were performed with a laboratory scale
plate-type ESP (length: 200 cm, height: 40 cm, duct width: 20 cm), described in a previous
paper [3]. The distance of the 18 discharge electrodes was set to 10 cm, the vertical
distance of the barbes was 4,8 cm. The temperature of the gas was feed back computer
controlled 300 C, the dewpoint was 150 C. For all experiments a
high-resistivity limestone fraction with a mean diameter of dp,50=
6![]() m was added to the gas. In order to
determine particle size distribution at different positions of the collecting electrode by
means of SEM photographs, the dust concentration was set to low values of 0, l g/m
m was added to the gas. In order to
determine particle size distribution at different positions of the collecting electrode by
means of SEM photographs, the dust concentration was set to low values of 0, l g/m
3. Dust Layer Porosity Investigations
The properties of the dust considerably influence the precipitation
process. For a dust resistivity in the range of 10 11![]() cm or higher, a remarkable voltage drop across the layer reduces the
electric field in the gap, resulting in a lower corona intensity, which means lower
particle charging and lower
cm or higher, a remarkable voltage drop across the layer reduces the
electric field in the gap, resulting in a lower corona intensity, which means lower
particle charging and lower
In order to investigate the structure of dust cakes from cake-forming surface filters, a special preparation method was developed by [7,8]. Here, the method was used for the investigation of ESP-dust layers. It will be briefly explained in the following.
Due to its vulnerability, a direct observation of a dust layer cross-section by means of a SEM is impossible. For this reason, a manageable stability of the dust layer must be guaranteed. To take dust layer probes at different positions along the collecting electrode, removable sampling devices were integrated in the collecting electrode. Samples of a high-density dust layer were taken opposite of the 3rd discharge electrode (ESP-inlet), 10th discharge electrode (ESP-middle) and 17th discharge electrode (ESP-outlet). Samples of a low-density dust layer were taken 5 cm in front and 2.4 cm above the high-density sampling positions (cf. black points of Fig. 2, left).
After having collected an appropriate dust layer on the sampling devices, the layer specimens were prestabilized by exposing them to an atmosphere of a cyano acrylate based single component adhesive vapor, which was mixed with nitrogen. A thin adhesive film, which strengthened the points of particle contact, was formed around the particles, keeping the dust
layer moist on the one hand and the vapor dry on the other. Then, the stabilized dust layer was embedded in a low-viscosity substance, consisting of epoxy resin, plasticizer, hardener and accelerator. Subsequently, the specimen was cured in a drying oven at 750 C for 24 h. In order to observe cross-sections of the dust layer with an SEM, the cured specimen were cut into small cubes, which were grinded and polished. Since a SEM only resolves the local superficial relief, the particles had finally to be resolved from the cross-section by hydrochloric acid. Hereby, the acid solely removes the limestone particles, not damaging the embedding material. The cavities perfectly illustrate the former locations of particles within the dust layer cross section.As a result of this sophisticated preparation procedure, one obtains a perfect picture of the vertical structure of the dust layer (Fig. 3). The dark areas of the SEM-photographs represent particles, the light areas show the gaseous interspaces of the dust layer.
The visual inspection was impressively confirmed. Directly opposite the barbes, the dust layer appears compact with significantly smaller interspaces, (Fig. 3, left). Half way between the discharge electrodes, large interspaces occur, which clearly indicate a considerably lower number of particle contacts (Fig. 3, right).
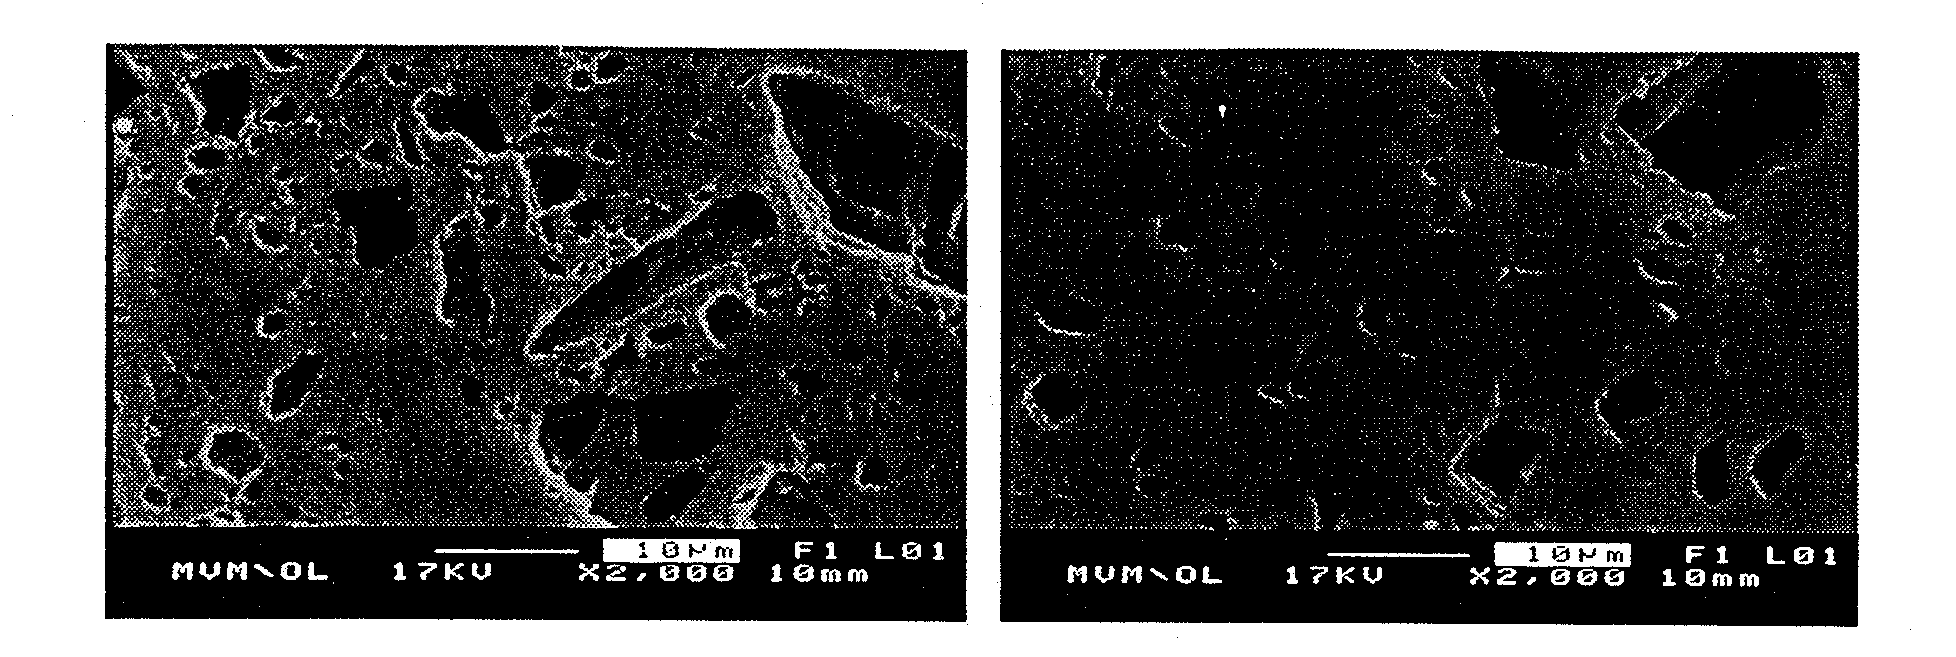
Fig 3: SEM photographs of a dust
layer cross section: a) inside dust layer ellipses, b) outside
dust layer ellipses.
A quantitative characterization of a material's structure is possible through the determination of the (volumetric) porosity, which is defined as the ratio of the void volume to the total volume P
V=VV/N. By analogy, for solid particles an areal porosity provides the same information and can be obtained from the analysis of a cross-section area. In this case the (areal) porosity can be defined as the ratio of the void area to the total area PA=AV/A. Using an image evaluation software this value can be easily calculated. Upon scanning the photographs and defining a threshold brightness level, the photographs can automatically be categorized in dark and white areas. The porosity is obtained by counting black and white pixels and calculating the ratio of white pixels to the ratio of all pixels. The results for the photographs of Fig. 6 is given in Table 1.Table 1: Areal porosity of different dust layer areas.

Since at the moment not all of the photographs have been analyzed, the values of table I do not represent the final results. However, they clearly indicate the completely different dust layer structure in both dust layer areas. Photographs and porosity calculations prove that clamping forces are considerably lower in interspaces, since the dust layer mass is retained only by a lower number of contact points in these regions, presumably leading to a higher erosion rate.
4. Dust Layer Mass Along the Duct
In order to assess whether the erosion of the dust layer is influenced by the dust layer's structure, long-time collection experiments (i.e. 45 min.) were conducted without rapping. During the collection process the dust layer thickness changed completely. After only a few minutes, the low-density areas were significantly thicker than the high- density areas and the masses of the high- and low-density
areas were almost identical. The layer looked exactly as previously demonstrated by [4]. However, upon collection of a dust layer for 45 minutes, the upper part of the low-density layer was dislodged by the gas flow and the high-density layer regions were considerably thicker (Fig. 4, left).To gain a quantitative result, dust layer samples of 6 CM2 were carefully removed from the collecting electrode by a special cylindrical tube and weightened with a high accuracy balance (resolution: 0. I mg). Multiple probes were taken along the duct from high-density areas as well as from low-density areas.
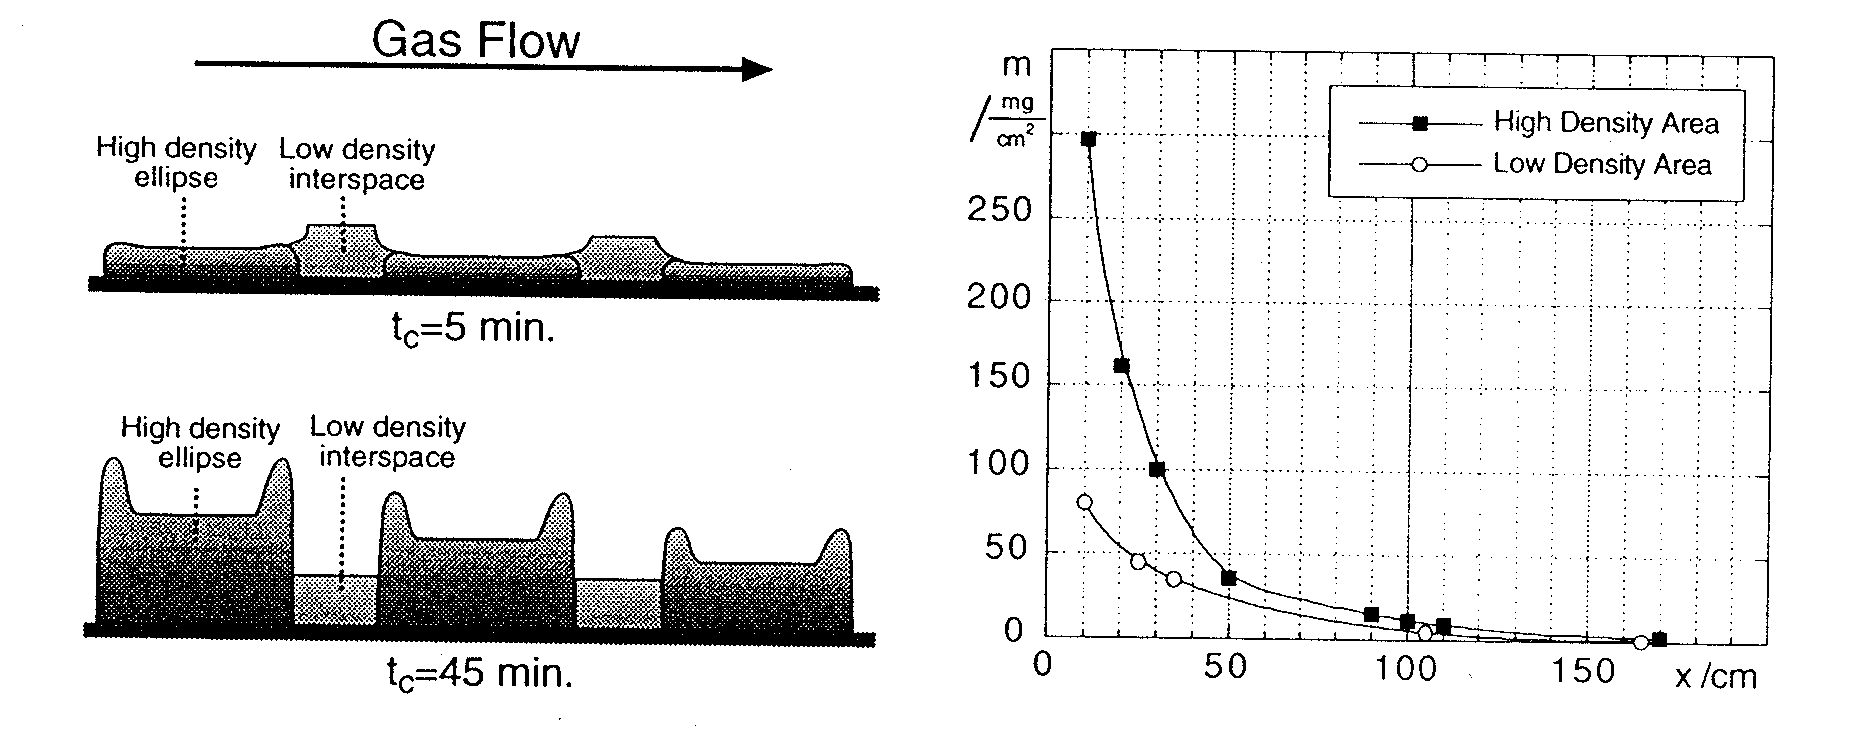
Fig. 4: Left: Basic behavior of dust layer thickness for different
collection times. Right: Dust mass inside and outside
of ellipsoidal areas after 45
minutes of dust layer growth.
The results (Fig.4, right) show an extreme difference in dust layer mass of high- and low-density areas at the ESP-inlet, which decreases along the duct. This massive discrepancy between high- and low-density areas cannot be explained solely by the higher porosity of the low-density areas. It must be the result of gas-flow forces, which primarily detach particles and agglomerates from those low-density regions of the dust layer.
Investigations of local back corona occurrence at the duct inlet revealed high back corona intensity in the low-density regions of the duct inlet [6]. Porosity investigations and mass determinations can explain this phenomenon. Since the dust layer quickly grows at the ESP-inlet, erosion reduces the layer thickness in the low-density regions. The total volume resistance of the layer in this regions becomes lower compared to the compressed high-density ellipses. Whereas for clean collecting electrodes the maximum current density appears directly opposite of the barbes, a current dislocation to low density regions takes place during the collection of high-resistive dust, In these regions, less particle contact points with high contact resistance cause high voltage drops from particle to particle. Therefore, the resulting electric field strength in the vicinity of these contact points is unfavorably high and leads to the disadvantageous occurrence of back ionization.
5. Local Deposition of Particles and Particle Flux
Whereas large particles are satisfactorily collected in an ESP. an
efficiency minimum occurs in the particle size range of 0,2 - 0,5 ![]() m [5,12]. Whereas large particles are
mainly collected in the ESP inlet, the fine dust fraction is predominantly collected in
the subsequent part of ESP ducts. Hence, the particle size distribution of the dust is
shifted to smaller particle sizes while passing the duct [5,9]. Unfortunately, most
investigations on this topic either deal with wire electrodes or do not consider that
different dust layer structures appear at the same horizontal coordinate of an ESP duct
when using bar e discharge electrodes. For this reason, particle size distributions were
determined from SEM photographs of both high and low-density areas at the inlet (x=0,3 m),
middle (x=1,0 m) and outlet (x=1,7 m) of the duct. Since the particle concentration in the
gas decreases along the duct, the collection duration for an optimum particle covering of
the samples had to be adapted for each sample position. The applied direct voltage was
adjusted at 58 kV.
m [5,12]. Whereas large particles are
mainly collected in the ESP inlet, the fine dust fraction is predominantly collected in
the subsequent part of ESP ducts. Hence, the particle size distribution of the dust is
shifted to smaller particle sizes while passing the duct [5,9]. Unfortunately, most
investigations on this topic either deal with wire electrodes or do not consider that
different dust layer structures appear at the same horizontal coordinate of an ESP duct
when using bar e discharge electrodes. For this reason, particle size distributions were
determined from SEM photographs of both high and low-density areas at the inlet (x=0,3 m),
middle (x=1,0 m) and outlet (x=1,7 m) of the duct. Since the particle concentration in the
gas decreases along the duct, the collection duration for an optimum particle covering of
the samples had to be adapted for each sample position. The applied direct voltage was
adjusted at 58 kV.
Fig. 5 exemplarily illustrates that the particle size decreases from the inlet towards the middle of the duct. More ver, the total amount of particles is clearly lower at the middle ml 0of the duct, considering that the collection duration tc was four times longer there.
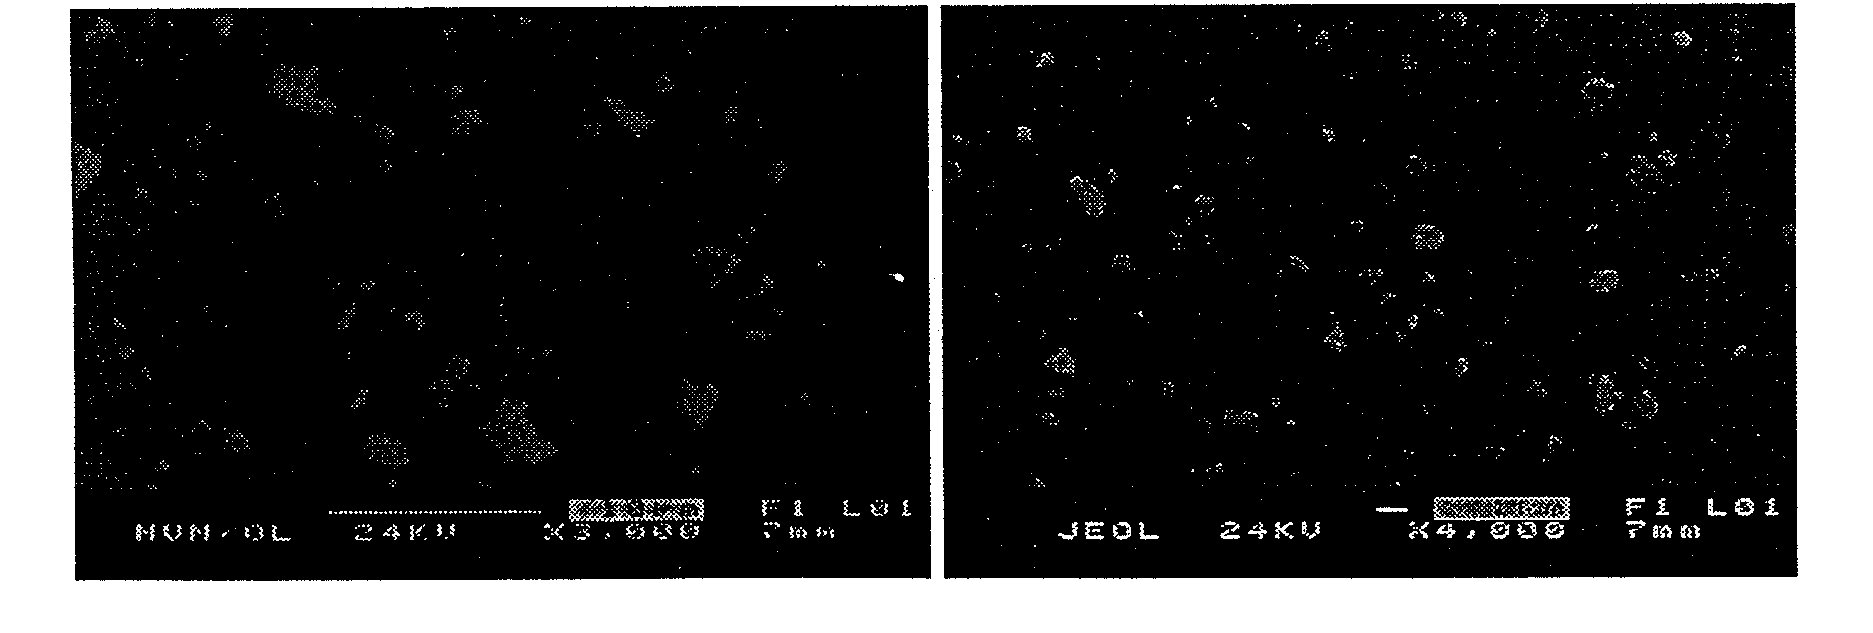
Fig 5: SEM-photographs of the collecting electrode surface. Left:
ESP-inlet (tc=1min.,
magnification: 3000).Right: Middle
of ESP (tc=4min.,Magnification: 4000).
All SEM-photographs were scanned and digitally analyzed with the same image evaluation software. In order to receive a comparable particle flux Jp for all sampling positions, the obtained particle numbers were classified in constant intervals of particle size and 'related to the total observed collector area and to the individual collection duration (Fig. 6).
The SEM-analyses demonstrate that the particle flux towards the collecting electrode decreases along the ESP-duct in the high-density areas (Fig. 6, left) as well as in the low-density areas (Fig.,6, right).
Moreover, the shift of the particle size distribution from the inlet to the middle of the duct is clearly visible, whereas the change in particle sizes from the middle to the outlet can be considered as unimportant.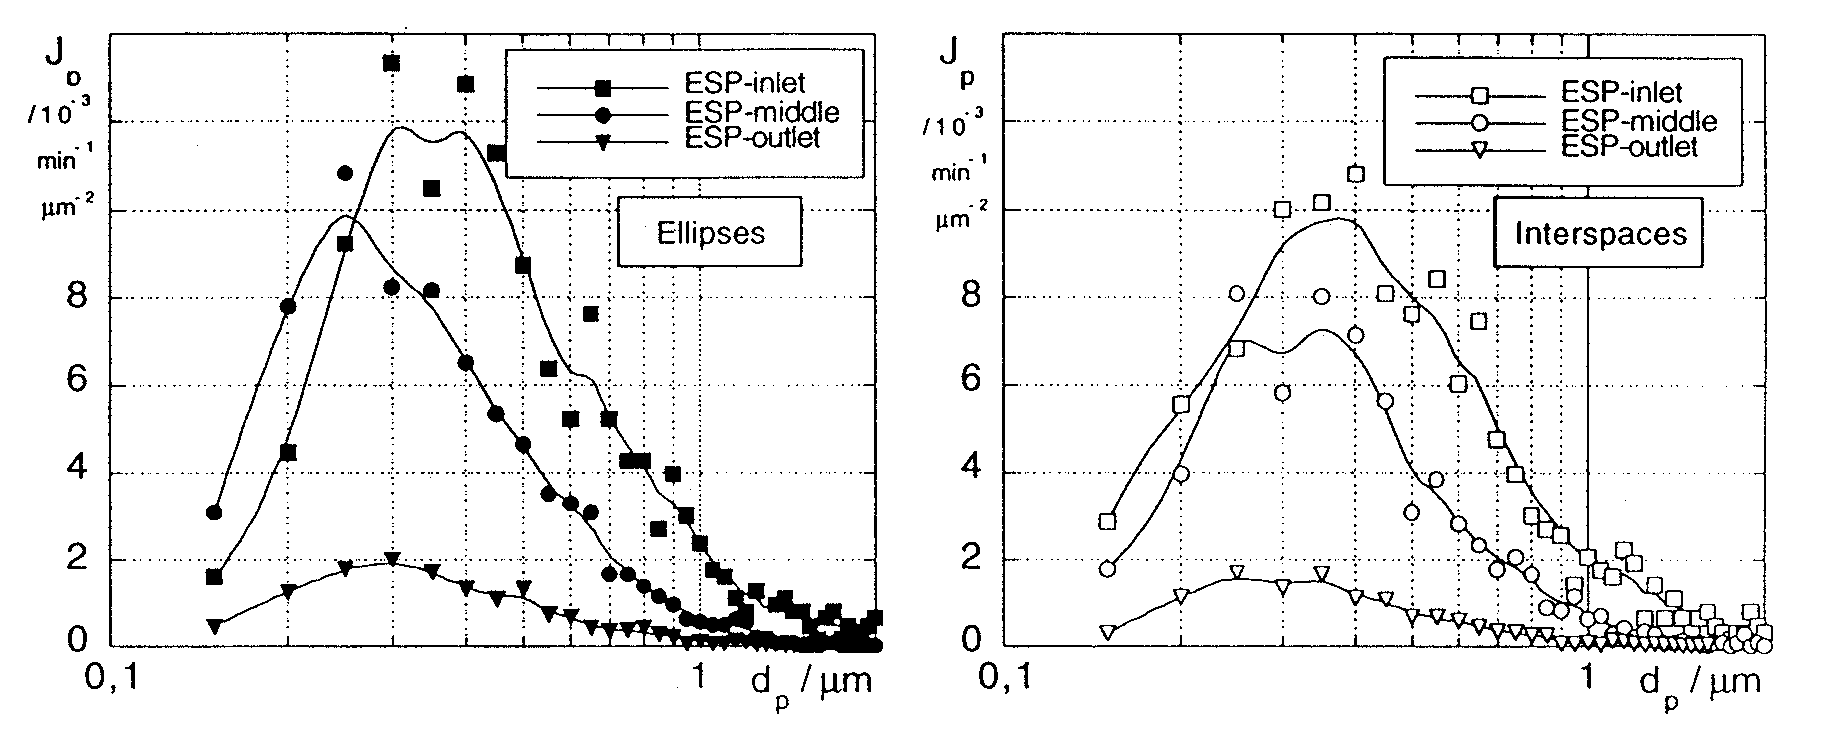
Fig 6: Particle flux, determined by analyzing SEM-photographs. Left: Ellipses (high-density areas). Right: Interspaces (low-density areas).
In order to assess the difference in particle flux between high-density areas and low density areas, it is useful to combine the flux curves of the different dust layer areas in one diagram (Fig. 7).
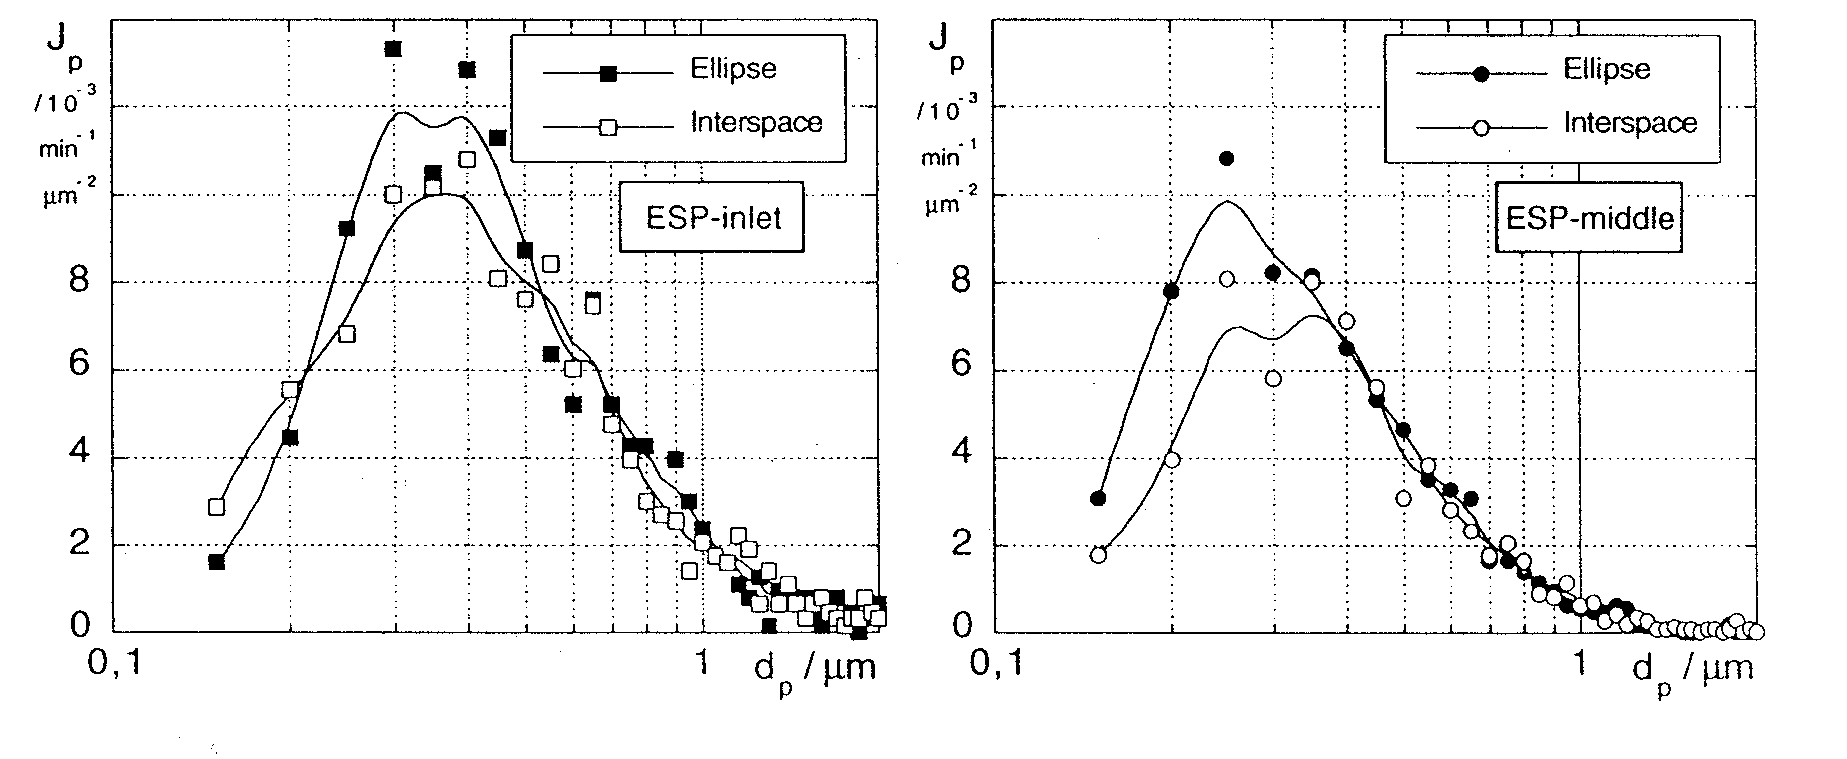
Fig. 7: Particle flux in ellipses (high-density areas) and
interspaces (low-density areas).
Left.- Inlet of ESP-duct.
Right: Middle of ESP-duct.
The plots for the ESP-inlet and the ESP-middle position clearly prove that particularly below 0,5 µm, considerably more particles were collected in the high-density areas. In the range of the modal value the difference was about 25% - 40% at all positions along the duct. Due to the fact that the low-density sample positions had been located 5 cm upstream of the high-density sample positions, this behavior is even more severe than expressed by the curves of Fig. 7.
Considering that fine particles are highly sensitive to forces of the
gas flow, it is obvious that especially in regions of flow jets towards the collecting
electrode, the movement of these particles is massively supported by the electric wind.
Here, the electric field force and the gas flow approximately have the same direction,
leading to higher migration velocities and an improved particle transport. Half way
between the discharge electrodes, the back flow is directed against the particle
migration. In these regions, the arrival rate of fine particles at the collecting
electrode is reduced. From this point of view, it is also obvious that heavily charged
particles, sizing above 1![]() m, are
less affected by the secondary gas as are the submicron particles.
m, are
less affected by the secondary gas as are the submicron particles.
5. Conclusions
These investigations kept special attention on the structures of the dust layer, occurring with barbed discharge electrodes in ESPS. The results prove that the electric wind supports the formation of a low-porosity layer in the opposite of the coronating barbes. Particle flux evaluations in different areas of the collecting electrode show that fine particles are preferably collected in highly packed dust layer regions. Because submicron particle collection is still a problem for ESPS, the results indicate an opportunity for higher fine dust efficiency: If discharge and collecting electrodes are designed in such a way that the share of high-density dust layer areas to the total collecting area is maximized, more particles in the size range of the ESP-efficiency minimum will be precipitated. A probable approach to reaching this goal has been suggested in [10,11]. Moreover, the results indicate that a geometry optimization will also reduce the intensity of back corona, leading to a better ESP-performance for high-resistivity dust.
6. Acknowledgements
These investigations are part of a research project, which is financially supported by the PEF (Projekt Europdisches Forschungszentrum fair MaBnahmen zur Luftreinhaltung).
7. References
[1] Robinson, M.
Movement of Air in the Electric Wind of the Corona Discharge
AIEE 1961, pp. 143-150
[2] Kercher, H.
Elekrischer Wind, Ruckspruyhen und Staubwiderstand als Einflubigroben im Elektrofilter
VDI-Fortschrittberichte Reihe 6 (1970), Nr. 27, VDI-Verlag Dusseldorf
[3] Miller, J.; Schwab, A.J
Feinstaubabscheidung in betriebsoptimierten
Elektrofiltern
Berichte Umweltforschung Baden-Wurttemberg, FZKA-PEF 140
(Marz 1996)
[4] Mitchner, M.; Fisher, M.J.; Gere, D.S.; Leach, R.N.; Self, S.A.
Surface Reentrainment of Collected Fly Ash in
Electrostatic Precipitators
3rd EPA Symposium on Particulate Control Technology,
Orlando 1981
[5] Oglesby, S.; Nichols, G.
Electrostatic Precipitation,
Pollution Engineering and Technology Vol.8Marcel Dekker
Inc., New York 1978
[6] Miller, J.- Schwab, A.J.
Fractional Efficiency Investigations under Back Corona
Conditions Considering the LocalOccurrence of
Back Corona at the Dust Layer of Electrostatic Precipitators
6th International Conference on Electrostatic
Precipitation, Budapest, 1996
[7] Schmidt, E.; Loffler, F.
Praparation von Staubkuchen
Staub-Reinhaltung der Luft 49 (1989), pp. 429-432
[8] Schmidt, E.; Loffler, F.
The Analysis of Dust Cake Structures
Part. Part. Syst. Charct. 8 (1991), pp. 105-109
[9] Riehle C.
Zur Messung und Beschreibung des korngobenabhangigen
Stofftransportes in
Elektrofiltern
Staub-Reinhaltung der Luft 53 (1993), S. 383-388
[10] Miller, J.; Schwab, A.J.
The Influence of Electrode Geometry,
EHD-Field and Dust Layer Formation on Fine DustEfficiency of
Electrostatic Precipitators
Proc. International Symposium "Filtration
and Separation of Fine Dust", Vienna, 1996, pp.182-193
[I 1] Miller, J.; Schwab, A.J.
Improved Discharge Electrode Design Yields
Favorable EHD-Field with Low Reentrainment Losses in
Electrostatic Precipitators
6th International Conference on Electrostatic
Precipitation, Budapest, 1996
[12] Miller, J.; Schwab, A.J
Fractional Efficiency Studies of an Electrostatic Precipitator Energized by Pulse
10th Particulate Control Symposium and 5th International Conference on Electrostatic
Precipitation,
Washington D.C., USA 1993
Back to the This Old Box page.
Back to APC Network Main Page
Last updated: April 12, 1999.
Copyright © 1997 TRK Engineering Services, Inc. All rights reserved.
For more information contact: TRK Engineering Services - 95 Clarks Farm Road - Carlisle,
MA 01741 - Telephone: 978-287-0550 - Fax: 978-287-0569 - email: trkeng@apcnetwork.com